In the world of tech stocks, the two leading names are Apple and Microsoft. While some investors may prefer to buy individual stocks, others want an easier way to invest in the overall sector.
If that’s the case for you, consider buying shares of one of these two ETFs: Vanguard Information Technology Index (VGT) or Invesco QQQ ETF (QQQ). Both funds offer broad exposure to major tech players—including big names like Google and Facebook.
But how do they stack up against each other? In this article, we’ll be comparing VGT and QQQ to help you decide which is the right tech ETF for your portfolio.
VGT: Vanguard Information Technology Index
The Vanguard Information Technology Index Fund (VGT) is a broadly diversified portfolio of U.S. stocks that tracks the performance of the MSCI US Investable Market Index/Information Technology 25/50.
VGT invests in companies in the information technology sector, which includes companies in the software, hardware, semiconductors, telecom, internet service providers, and computer services industries.
- Number of stocks: 371
- Media market cap: $275.2 billion
- Earnings growth rate: 25.4%
- Expense ratio: 0.10%
- Dividend distribution schedule: Quarterly
| COMPANY | SYMBOL | TOTAL NET ASSETS |
|---|---|---|
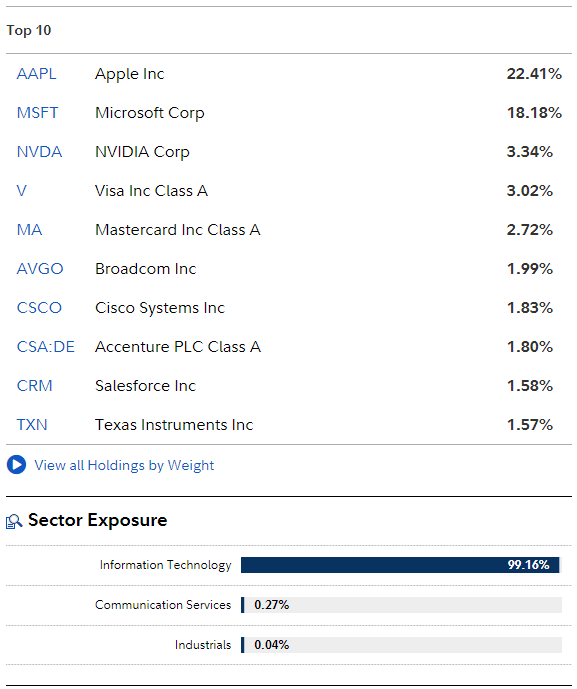
| Apple Inc. | AAPL | 22.47% |
| Microsoft Corp. | MSFT | 17.99% |
| NVIDIA Corp. | NVDA | 3.66% |
| Visa Inc. Cl A | V | 2.98% |
| Mastercard Inc. | MA | 2.73% |
| Broadcom Inc. | AVGO | 1.97% |
| Cisco Systems Inc. | CSCO | 1.80% |
| Accenture PLC Cl A | ACN | 1.77% |
| Adobe Inc. | ADBE | 1.71% |
| Salesforce Inc. | CRM | 1.51% |
| Technology | 80.44% |
| Industrials | 10.19% |
| Financials | 6.08% |
| Non Classified Equity | 1.89% |
| Oil & Gas | 0.68% |
| Consumer Services | 0.42% |
| Consumer Goods | 0.03% |
| Telecommunications | 0.01% |
Invesco QQQ ETF
QQQ is an exchange-traded fund that aims to provide exposure to the Nasdaq-100 Index. The fund includes the top 100 non-financial companies on the Nasdaq exchange.
The QQQ ETF is designed to help investors diversify their holdings and benefit from the growth of large-cap technology stocks.
- Number of stocks: 102
- Assets under management: $148.17 billion
- Expense ratio: 0.20%
| COMPANY | SYMBOL | TOTAL NET ASSETS |
|---|---|---|
| Apple Inc. | AAPL | 13.54% |
| Microsoft Corp. | MSFT | 10.41% |
| Amazon.com Inc. | AMZN | 6.86% |
| Tesla Inc. | TSLA | 4.56% |
| Alphabet Inc. Cl C | GOOG | 3.64% |
| Alphabet Inc. Cl A | GOOGL | 3.46% |
| Meta Platforms Inc. | META | 2.98% |
| NVIDIA Corp. | NVDA | 2.83% |
| PepsiCo Inc. | PEP | 2.09% |
| Costco Wholesale Corp. | COST | 2.04% |
| Technology | 56.26% |
| Consumer Services | 17.20% |
| Consumer Goods | 10.52% |
| Health Care | 6.56% |
| Industrials | 5.83% |
| Telecommunications | 1.67% |
| Utilities | 1.16% |
| Non Classified Equity | 0.50% |
| Basic Materials | 0.26% |
VGT vs. QQQ: Similarities and Differences
VGT and QQQ are market cap-weighted ETFs, meaning that larger companies have a greater impact on performance than smaller ones. They are also passively managed and only invest in U.S-listed technology stocks.
Expense Ratio
The biggest difference between VGT and QQQ is the expense ratio. The Vanguard ETF has an expense ratio of 0.10% while the Invesco ETF charges double the price (0.20%). The disparity in fees is significant.
Sector Allocations
QQQ claims to be “more than just a tech fund.” At least 48% of QQQ’s assets are invested in the Information Technology sector. The rest goes into Consumer Discretionary, Communication Services, and Health Care.
In contrast, VGT has 99% of its sector exposure in Information Technology. VGT has more stocks than QQQ but is also highly concentrated in tech stocks.

Performance
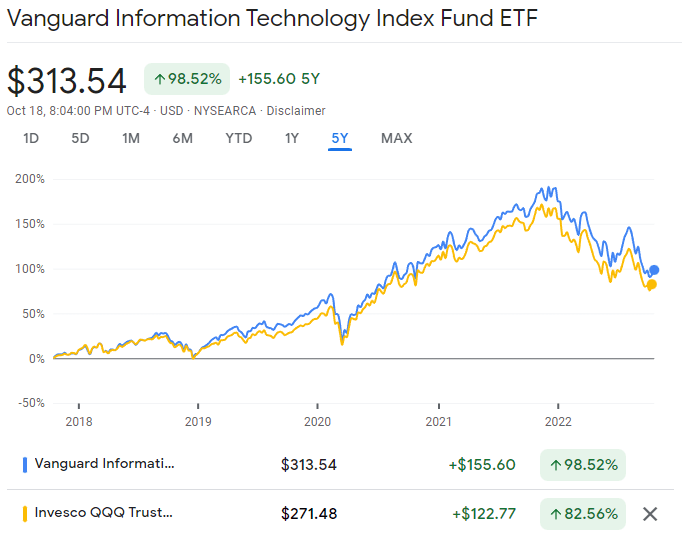
In terms of performance, VGT has outperformed QQQ since the beginning of 2019. The 5-year total return of VGT is 98.52%, whereas QQQ’s total return is 82.56% within the same period.

VGT vs. QQQ: Which Is Better?
Ed H:
VGT (an index fund) is supposed to be a Vanguard alternative to QQQ.
Its current benchmark is the MSCI US Investable Market Information Technology 25/50 Transition Index.
Wright T:
Technology companies have only outperformed recently. There are plenty of periods where they have gotten crushed. Heavily tilting your portfolio towards them after a significant runup in prices probably isn’t good.
I would suggest remaining diversified and using a total stock market index fund like VTSAX or FSKAX rather than trying to time the market with sector-tilted funds.
VGT is a Technology ETF. It isn’t diversified and only has exposure in one sector of the market. QQQ is the Nasdaq 100 Index fund that invests most of its assets in tech companies. It is more diversified than VGT but still heavily skewed towards the tech sector.
Eric T:
I bought the VGT ETF because I wanted more exposure to U.S. tech. I’ll own it forever (or near forever) because tech will always be relevant. I’ve never looked at its past performance because my returns reside in the future, not the past. That’s all.
Mike R:
VGT is more focused on infotech; QQQ has fewer holdings. VGT has more mid and small-cap exposure.
Invesco’s QQQ includes Amazon; VGT doesn’t. QQQ has more AAPL than MSFT but less of both than VGT. I don’t think VGT has GOOGL but don’t quote me on that. VGT has performed better than QQQ over the past five years by over 15%. So really, it just depends on what you want.
Larry M:
I own VGT, and it’s been a very good fund. Whether it’s a good fund to own in the future depends on when the tech boom ends, it could be over now. Many would argue that tech is overvalued, and if they are correct, it would be a bad time to buy VGT.
What’s the Fidelity Equivalent of VGT?
FTEC is the Fidelity equivalent of VGT. Both ETFs track the same underlying benchmark. The expense ratio of FTEC is 0.08%.
